PROJECT Summary
July 2019 - October 2019
This visual tool was designed for use in the model creation process of OnPoint’s machine learning product, CORTEX. The goal of this tool was to provide users the ability to visualize their data to better understand relationships between variables before creating a machine learning model.
Tools:
Sketch
InVision
Ideation
User Research
User Problem
Understanding your data is an integral part of utilizing data science, the relationships between variables is important to know when creating a machine learning algorithm. CORTEX provides the ability for engineers to run ML algorithms on plant process data to determine process improvements or solve vague problems occurring within the plant. The amount of data available from plant historians often makes this a challenge, some variables are well understood, but when working with hundreds or thousands it can be difficult to know which variables are important.
This is a challenge that we often experienced utilizing CORTEX, so we decided to provide a means of understanding large amounts of data and the relationships between large numbers of variables. We wanted to help users more effectively apply machine learning to their data and we wanted to drive that by allowing them to explore their data visually.
Design
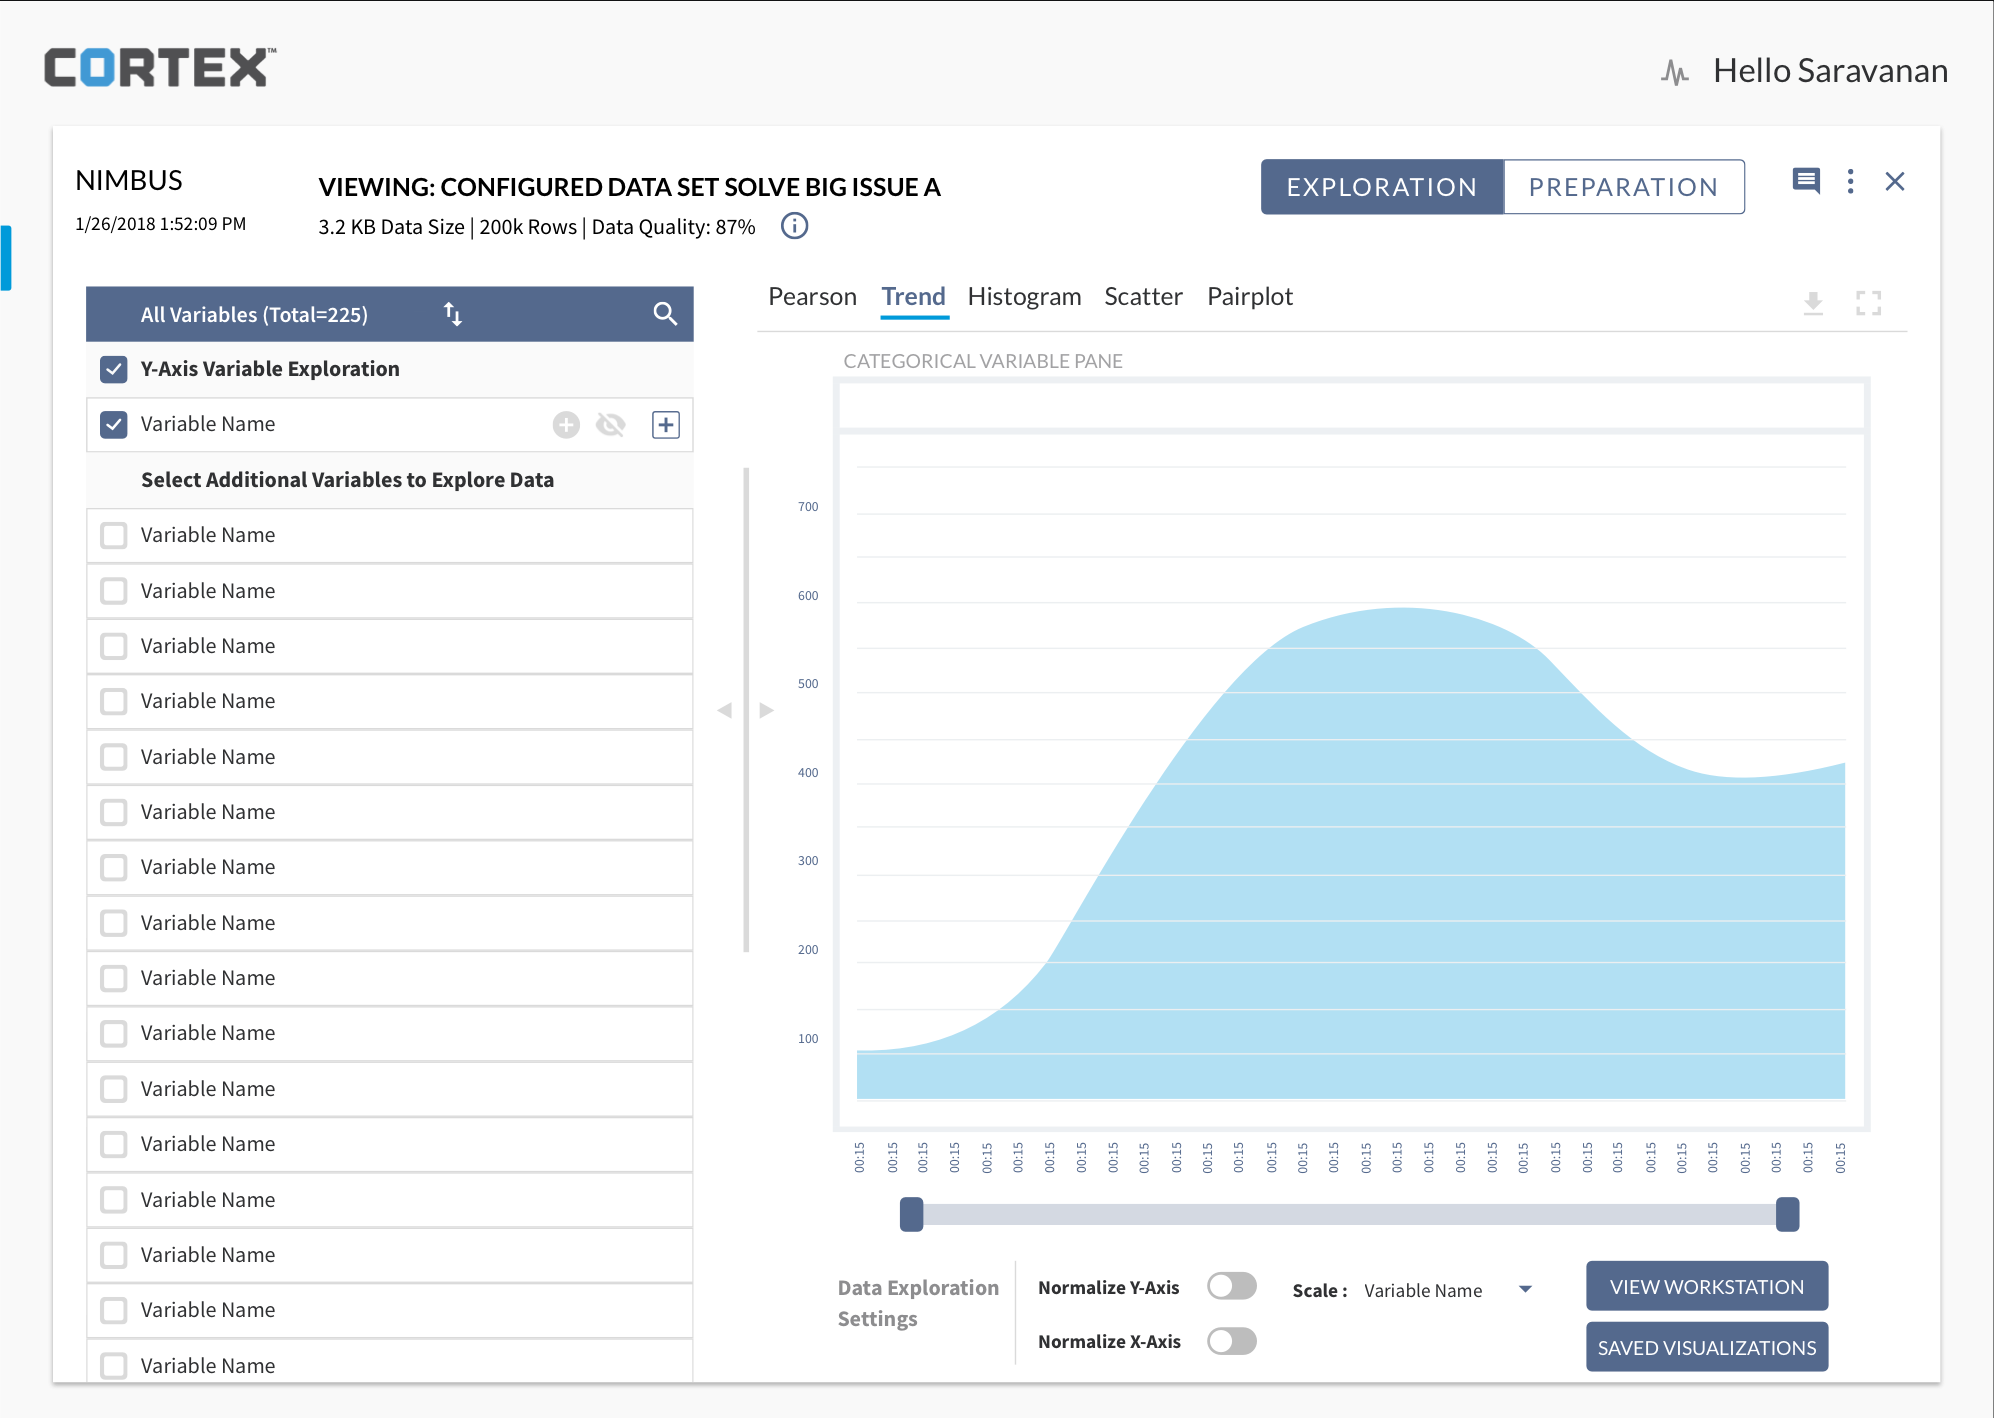
I designed the Data Exploration tool over a number of months, working with a set of sponsored users and a dedicated development team. These are examples of the types of visualizations that a user can choose from to explore their data. Certain types of data are better suited for particular visualization types, but it is a fairly free-form process.
Sketches
Wireframes
Iterations
Data Preparation
Final Mockups
Categorical Variables
Next Steps
This project was handed over to another designer when implementation began and I was assigned to some new initiatives. CORTEX as a product currently exists as a stand alone software platform. We are currently looking at integrating CORTEX into the larger digital ecosystem that we have been creating.
Data Exploration is a valuable tool for the model setup process, but it also has much value as a purely data analysis tool. We will be looking at how we can leverage the visualization capability in other use cases.


